Beyond the Aloe Leaf: How Processing Methods Affect Acemannan Content, Structure, and Integrity
Explains how heat, filtration, drying, and storage change acemannan’s amount, molecular weight, and acetylation—and which lot tests to request.

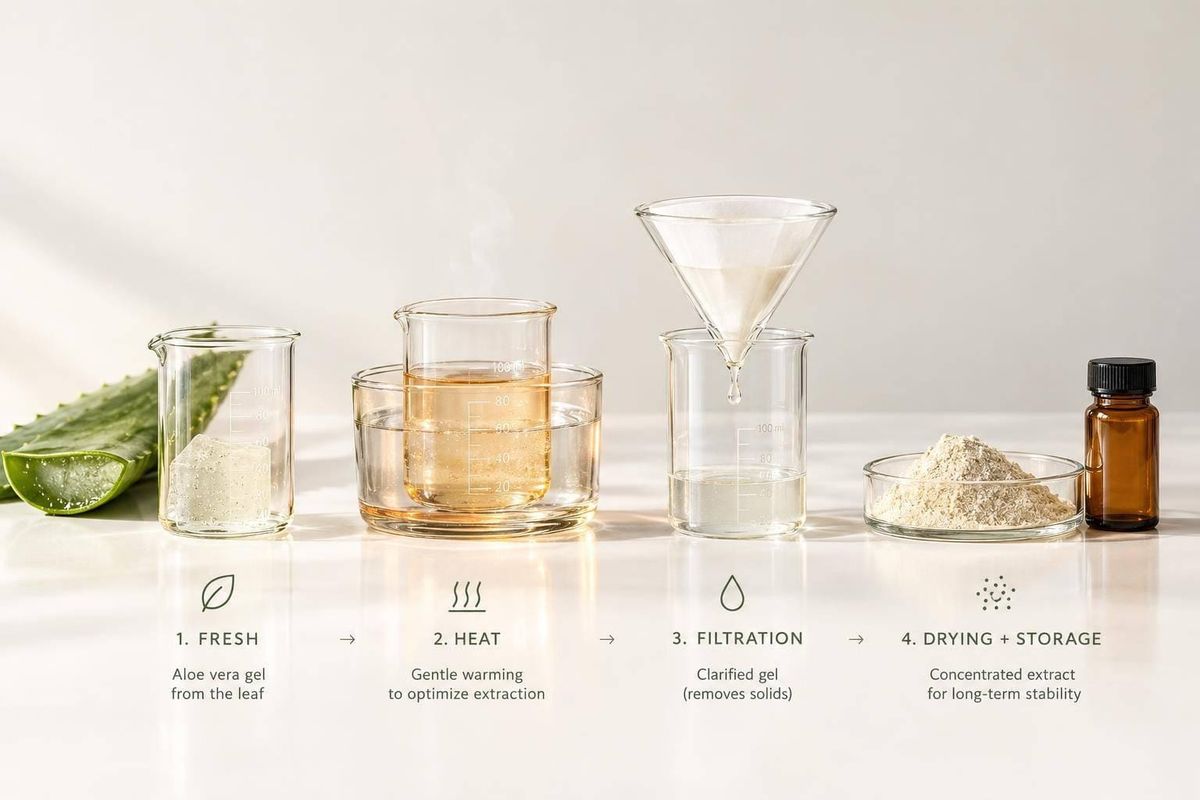
More acemannan doesn’t always mean better-preserved acemannan. I look for three things before comparing aloe products: the amount retained, polymer chain sizes, and acetyl-group retention. In one study, pasteurization increased recovered yield by about 40% - but that alone did not establish that the structure stayed intact.
Here’s what I check at each step:
- Heat: Time, temperature, moisture, and pH can affect recovery and structure.
- Filtration: A lower amount may mean material was removed - not broken down.
- Drying: Water removal can increase the reported percentage while reducing recovery or changing the polymer.
- Storage: Packaging, moisture, temperature, and time can change what remains through shelf life.
My rule: <u>ask for lot-specific test results, not just processing labels</u>. Compare results on the same measurement basis, and check both amount and structure. Neither proves a health effect - that requires separate human research on the finished product. Understanding these health benefits of acemannan is essential for evaluating product efficacy.
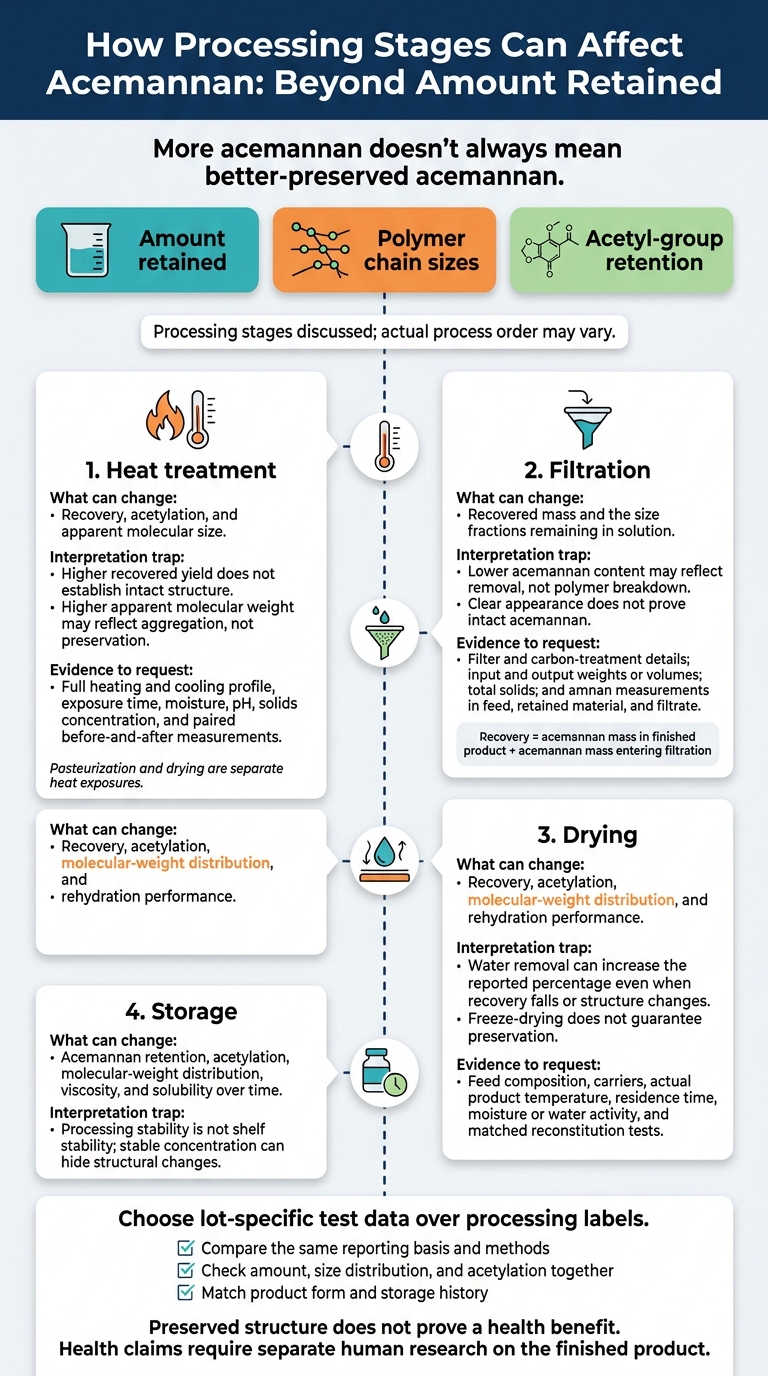
How Aloe Processing Affects Acemannan Quality
1. Heat Treatment
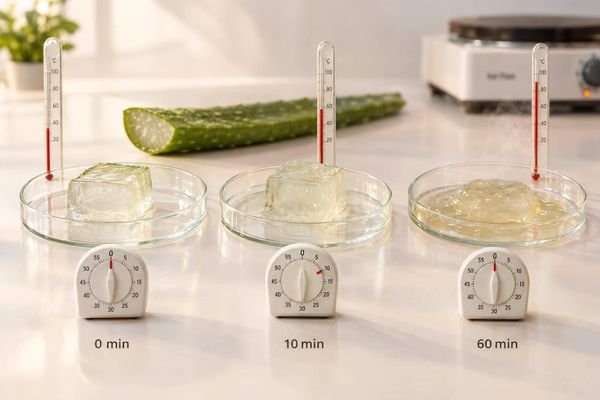
Heat is the first processing step that can increase recovery while changing acemannan’s structure. Wet pasteurization heats aloe with high moisture content; dry heat treats low-moisture material. That difference affects both heat transfer and polymer chemistry.
One study tested wet pasteurization at 149°F, 167°F, and 185°F (65°C, 75°C, and 85°C) for 15 or 25 minutes. These study settings are not universal preservation or control targets.
Acemannan Content and Recovery
Pasteurization has been reported to increase recovered acemannan yield by about 40%. But recovering more acemannan does not mean its structure stayed intact. Yield and structural retention are separate measures.
Degree of Acetylation
In one study, dry heat caused about 14% deacetylation at 140°F (60°C) and more than 46% at 176°F (80°C) or higher. These results depend on the treatment conditions, including pH. Under alkaline conditions, acetyl-group loss can be extensive within five minutes at 176°F (80°C).
Report acetylation alongside moisture, pH, and exposure time. Temperature alone does not tell the whole story.
Molecular-Weight Distribution
Heat can remove acetyl groups and encourage polymer chains to associate. So a higher apparent molecular weight may reflect aggregation - not preservation. Harsher treatment may instead break down the polymer backbone. Read chromatography results alongside acetylation, sample solubility, and calibration details.
Structural and Functional Integrity
Report the full heating and cooling profile, including ramp-up, hold time, moisture state, and solids concentration. Pair microbial-control targets with viscosity or solubility measurements taken before and after treatment.
Treat pasteurization and later drying as separate heat exposures. A controlled wet treatment does not establish what survives the next heating step, and later drying can further change the same polymer.
sbb-itb-b88dd21
2. Filtration
Filtration changes acemannan by separating solids from dissolved polymers - not by heating them again. It can lower measured acemannan without breaking the polymer.
Mechanical clarification removes solids, while activated carbon removes pigments and some dissolved compounds. Screens, depth filters, and diatomaceous earth remove pulp, fibers, and debris, but don’t necessarily remove dissolved latex-related compounds. Activated carbon can remove latex-related anthraquinones, including aloin. Ask which steps were used, not just whether the aloe was filtered.
Acemannan Content and Recovery
A lower acemannan concentration after filtration does not prove degradation. Material can be lost to pulp, sediment, carbon, membranes, or equipment. Testing only the finished product therefore cannot show recovery. Request input and output volumes or weights, total solids, and acemannan measurements reported on the same basis, such as milligrams per serving or grams per 100 grams of dry matter.
Recovery equals the acemannan mass in the finished product divided by the acemannan mass entering filtration. Testing discarded pulp, spent carbon, and rinse streams helps account for missing material. Whole-leaf and 100% aloe describe the source or aloe content - not acemannan recovery. Ask which aloe fraction was tested, at what processing stage, and with which analytical method.
Molecular-Weight Distribution
Filters can retain large gel aggregates, while membranes and activated carbon may selectively retain certain size fractions. Compare molecular-weight distributions before and after filtration using size-exclusion chromatography, with calibration and detection methods stated. A smaller high-molecular-weight fraction may reflect selective removal rather than broken polymer chains.
Structural and Functional Integrity
Clear appearance does not prove that acemannan is intact. Request paired measurements of acemannan abundance and degree of acetylation, along with viscosity or gel-forming tests when relevant. For carbon treatment, also request the carbon type, dose, contact time, pH, temperature, and aloin or anthraquinone results.
Filtration can change what remains in solution, but drying can still alter acetylation, molecular weight, and solubility.
3. Drying
Compare the full process, not just the dryer label. After filtration, drying can further change acemannan recovery, acetylation, and solubility. Check pretreatment, product temperature, and residence time. Clarification, filtration, concentration, carrier addition, and pH adjustment can all change the feed. Record the actual product temperature and residence time - chamber settings alone don’t show how much heat the product receives.
| Method | How water is removed | Key process details to check |
|---|---|---|
| Spray drying | Liquid droplets dry quickly in hot gas. | Feed concentration, carrier addition, and droplet heat exposure. Carriers can dilute the powder’s measured acemannan fraction. |
| Freeze-drying | Frozen water leaves by sublimation under vacuum. | Freezing rate, vacuum conditions, and the long drying cycle. Low direct heat doesn’t guarantee preservation. |
| Refractance-window drying | A thin gel layer dries on a film heated by hot water below boiling. | Layer thickness, product temperature, and residence time. |
| Radiation-zone drying | Radiant energy drives moisture removal. | Radiation intensity, surface temperature, and exposure time. |
| Oven dehydration | Heated air removes water, generally over longer periods. | Time at elevated product temperatures, especially near or above 158°F (70°C), where deacetylation has been reported. |
Acemannan Content and Recovery
Comparative research reported about a 40% drop in acemannan yield across spray drying, freeze-drying, refractance-window drying, and radiation-zone drying. Compare recovery on an original-liquid or fresh-gel basis alongside dry-weight concentration, including carrier solids in the calculation.
Molecular-Weight Distribution
The amount recovered is only part of the picture. One comparison reported a molecular-weight shift from approximately 49 kDa to 23–26 kDa after these four methods. That result is specific to the study: branching, incomplete dissolution, and calibration can all affect apparent molecular weight. Request the full molecular-weight distribution, not just one average.
Degree of Acetylation
Acetylation offers a separate check on integrity. Reported reductions were about 70% for spray drying, 52% for refractance-window drying, 60% for radiation-zone drying, and 20% in one freeze-dried analysis. Use finished-lot acetylation testing, and check the stated test method.
Structural and Functional Integrity
Test rehydration with the same water-to-solids ratio, temperature, mixing time, and rest period. In one dehydration study, water retention fell about 50%, while swelling and fat adsorption capacity decreased by more than 80%. For dried powders, verify moisture and water activity before judging rehydration performance.
4. Storage
After drying, storage is the next stress test for acemannan. Processing stability is not shelf stability. Processing, filling, and transport can change acemannan before packaging; shelf stability starts afterward. Ask for data at each stage, including product form, storage time, temperature, humidity, packaging, and test method - not just one expiration-date result.
Acemannan Content and Recovery
For a 24-month shelf-life claim, request real-time measurements at 0, 3, 6, 12, and 24 months, compared with the post-processing baseline. Use accelerated testing only to screen for risks. Store at 36–46°F (2–8°C) only if that condition has been validated for the exact formula and package.
Structural and Functional Integrity
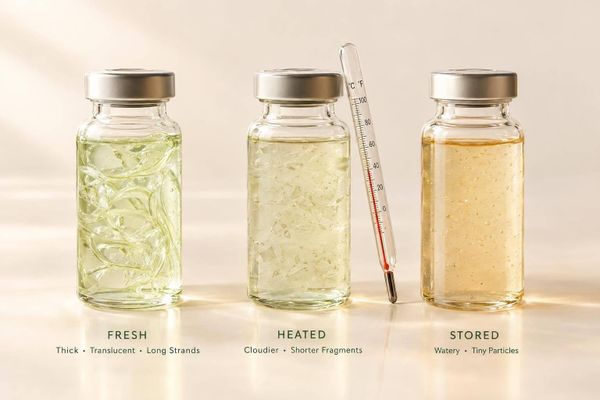
Storage can change acemannan’s structure, not just its amount. Liquids need controls for microbial growth, pH drift, oxygen, and light exposure. Request data on acemannan retention, viscosity, pH, microbial quality, and sediment or precipitation in the intended container. Antimicrobial agents alone do not establish polymer stability: aloe storage research found that they did not do much to prevent polysaccharide breakdown.
Liquids and powders fail for different reasons, so storage data must match the product form. For powders, moisture uptake after opening is a concern. Refrigeration can backfire if condensation adds moisture. Check moisture-barrier liners, seal integrity, and opening instructions. For light protection, a review recommends dark or opaque glass containers for aloe gel or powder.
Degree of Acetylation
Ask whether testing tracked acetylation and molecular-weight distribution throughout storage - not just total polysaccharide content. A stable concentration can hide loss of acetyl groups, chain breakdown, or aggregation. Separate unopened-package results from testing after opening, when humidity and oxygen exposure change.
What Acemannan Measurements Can and Cannot Show
Heat treatment, filtration, drying, and storage can change acemannan’s amount, size, and acetylation. Measurements can track these changes, along with flow behavior - but the sample basis must be clear to interpret the results.
Content and recovery. Report mg acemannan/g dry solids, the original gel mass, and the total acemannan recovered. Distinguish acemannan from total polysaccharides, and state whether results are based on wet weight, dry weight, extract, or finished product.
| Processing stage | Observations | Confounders | Verification tests |
|---|---|---|---|
| Fresh gel | Starting acemannan mass | Natural variation; extraction efficiency | Moisture, total solids, validated acemannan assay |
| Filtration | Acemannan mass in each stream | Removal of fiber-associated material | Test feed, retained material, and filtrate; balance masses |
| Heat treatment | Recoverable acemannan mass | Evaporation; altered assay accessibility | Correct for solids; repeat the same assay |
| Drying | Concentration and recovered mass | Water removal; insolubilization; incomplete extraction | Starting dry matter, recovered powder mass, moisture, and acemannan mass |
| Storage | Acemannan retention | Moisture changes; sampling variation | Solids-normalized assay with replicate testing |
Molecular-weight distribution. Ask for the full size distribution, not just an average. Include sample preparation and chromatography details so readers can interpret the apparent size.
| Processing stage | Observations | Confounders | Verification tests |
|---|---|---|---|
| Fresh gel | Reference size distribution | Extraction can select certain fractions | Validated size-exclusion chromatography (SEC); solubility recovery |
| Filtration | Size-fraction distribution | Membrane adsorption; selective removal | Compare distributions and recovered mass across streams |
| Heat treatment | Apparent molecular-size shifts | Cleavage, aggregation, column exclusion | SEC–multi-angle light scattering (SEC-MALS), with structural analysis |
| Drying | Rehydrated size distribution | Incomplete dissolution; concentration-dependent association | Matched rehydration; soluble and insoluble recovery checks |
| Storage | Size distribution over time | Preparation losses; analytical drift | Same method and reference controls |
Use the same dissolution time, pH, ionic strength, preparation filters, and injection concentration when comparing samples. Report the column, detector, calibration, and mobile-phase details.
Acetylation. Report the degree of acetylation using quantitative proton nuclear magnetic resonance (¹H NMR). Disclose the calculation, internal standard, solvent, temperature, acquisition settings, and integration regions.
| Processing stage | Observations | Confounders | Verification tests |
|---|---|---|---|
| Fresh gel | Baseline acetylation | Extraction bias; moisture; baseline treatment | Quantitative ¹H NMR validated for specificity, repeatability, recovery, and detection limits |
| Filtration | Acetylation by fraction | Selective removal rather than deacetylation | Compare feed and separated fractions |
| Heat treatment | Degree of acetylation | Preparation damage; baseline correction | Matched NMR preparation and integration |
| Drying | Acetylation after reconstitution | Poor dissolution; moisture differences | Dissolution recovery and repeat NMR measurements |
| Storage | Acetylation over time | Insufficient sensitivity; assay drift | Stability-indicating NMR with controls |
Structural and functional integrity. Retaining the backbone does not prove that the side chains remain intact.
Compare viscosity only when concentration, solids, temperature, pH, ionic strength, shear rate, instrument geometry, and hydration time match. No single viscosity or structural test proves clinical benefit.
| Processing stage | Observations | Confounders | Verification tests |
|---|---|---|---|
| Fresh gel | Reference structure and viscosity | Native particles; variable solids | NMR, linkage analysis, monosaccharide profiling, matched-condition viscosity |
| Filtration | Composition and viscosity | Particle removal; loss of larger fractions | Structural tests alongside stream recovery |
| Heat treatment | Backbone and side-chain integrity | Aggregation can increase viscosity | NMR, linkage analysis, SEC, matched-condition viscosity |
| Drying | Rehydrated structure and viscosity | Hydration differences; insoluble particles | Dissolution checks and complementary structural tests |
| Storage | Structure and viscosity over time | Concentration shifts; aggregation | Matched-condition viscosity paired with structural assays |
Processing Trade-Offs and Evidence to Request
Judge each process by what it preserves and what it changes. Safety, preservation, cost, and handling often involve trade-offs.
Use these questions to check whether a processing label has measurable data behind it.
| Processing stage | Trade-off to verify | Evidence to request |
|---|---|---|
| Heat treatment | Microbial control versus changes in acetylation and molecular weight | Time-temperature profile, pH, solids concentration, cooling conditions, microbial results, and before-and-after acemannan measurements |
| Filtration or clarification | Purity versus loss of acemannan-rich fractions and added handling | Filter specifications, pressure, passes, recovery yield, and before-and-after composition |
| Drying | Easier shipping and storage versus structural changes, yield loss, and reconstitution limits | Drying conditions, carriers, moisture or water activity, acemannan recovery, liquid-equivalent calculation, and reconstitution recovery |
| Stabilization/storage | Shelf life versus formulation, packaging, and handling requirements | Additives, packaging specifications, storage limits, compatibility results, and interval stability data |
A label describes a process. It doesn't prove the result. Here's what each claim leaves unanswered - and which records can help you check it.
| Claim | What the label does not prove | Evidence to request |
|---|---|---|
| Pasteurized | Amount retained and structural integrity | Starting material, process sequence, treatment conditions, and before-and-after content, acetylation, molecular-weight, and microbial results |
| Filtered | What was removed or retained | Clarification steps, including enzyme or charcoal use; recovery yield and composition of retained and removed fractions |
| Freeze-dried | Complete recovery or unchanged structure | Feed composition, carriers, cycle conditions, liquid-equivalent recovery, acetylation, molecular-weight distribution, and reconstitution results |
| Stabilized | Effective controls throughout shelf life | Treatments, packaging, storage conditions, interval results, and limits after opening or reconstitution |
| High acemannan | Identity, purity, integrity, or superior performance | Amount, units, denominator, moisture basis, serving size, assay, identity, purity, acetylation, and molecular-weight results - not total carbohydrate alone |
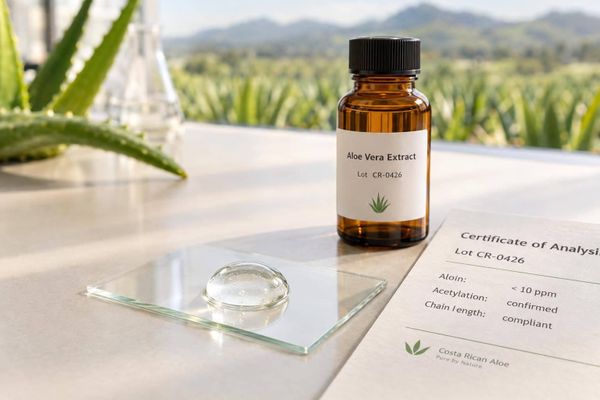
At a minimum, request lot-specific records to verify every claim: batch number, manufacture date, test date, lab, method version, assay performance data, and identity/purity results. These should include microbial, heavy-metal, pesticide, and latex-marker results with stated limits.
For storage claims, ask for release and interval data through the labeled shelf life. The records should state temperature, humidity, light, packaging, fill volume, and whether the package was open or unopened.
Conclusion: Choose Test Data Over Processing Labels
Acemannan quality is not one number. Read amount, molecular-weight distribution, and acetylation together to assess content, structure, and integrity. A higher concentration or molecular weight alone does not prove better preservation after heat, filtration, drying, and storage.
Compare results only when product form, reporting basis, method, and storage history match. Dry-weight and liquid-volume results are not interchangeable. Look for defined specifications, transparent methods, lot-specific finished-product data, and shelf-life stability results - not just processing claims.
Preserved structure does not prove a health benefit. Composition and stability tests describe the material. Health claims need separate human evidence for the finished product, dose, and intended use.
FAQs
How can I interpret an acemannan lab report?
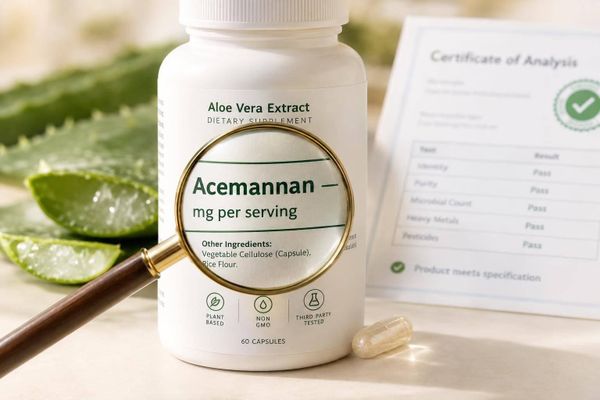
Ask for a lot-specific Certificate of Analysis (CoA) that matches your product’s packaging and covers the finished product. Check for numeric results with units, validated test methods, and a clear reporting basis: as-is or dry weight.
Review the acemannan amount together with its degree of acetylation and molecular-weight distribution. These measures help assess whether its structure held up during processing. Check microbial and safety results - including aloin levels - separately. An acemannan assay alone cannot confirm safety.
Are there established standards for acemannan quality?
There’s no industry-wide standard for acemannan quality in finished products. The IASC benchmark - 5% acetylated mannan by dry weight - applies only to raw materials.
“Cold-processed”
This is a marketing claim, not a regulated temperature standard. Instead of relying on the label, check a lot-specific Certificate of Analysis for the finished product. Look for acemannan concentration, degree of acetylation, and molecular-weight distribution.
How can I tell if storage has damaged acemannan?
Rely on lot-specific stability data. Color, flavor, odor, and viscosity can’t confirm structural integrity. Request a certificate of analysis (COA) for your lot that quantifies acemannan concentration, molecular-weight distribution, and acetylation.
Treat acemannan as potentially compromised if stability records don’t cover the final, sealed packaging under labeled storage conditions. The same applies if storage involved high humidity or temperatures above 104°F to 140°F.